Saving Graphs
While working with graphs, it may be necessary to capture
images of them for use in presentations or on web pages, etc. There’s also the
option to save Graphs as data files.
To save a single graph:
Saving All Graphs
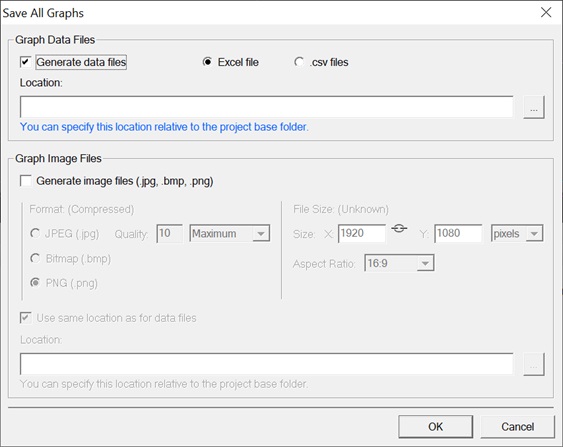
All graphs can be as images or data in a specified
location, in a single operation. Even graphs that are not currently displayed
in Graph Windows are saved. Include or exclude specific graphs by enabling or
disabling their Analyses in the Object Directory.
To save all graphs:
- On the Analysis tab of the Object Directory, enable or disable the Analyses of graphs to include or exclude.
- Right-click in a Graph Window and select Save All Graphs or select File > Save All Graphs.
- Click the browse button
 next to the Location box and
specify a folder location for the saved files.
Tip: If the folder you select is in the Project Base Folder, or a subfolder thereof, it is automatically converted to a relative path. See Creating an Analysis Project.
next to the Location box and
specify a folder location for the saved files.
Tip: If the folder you select is in the Project Base Folder, or a subfolder thereof, it is automatically converted to a relative path. See Creating an Analysis Project. - To generate data files, tick the Generate data files box. If data files aren’t needed, go to step 5.
- To generate image files, tick the Generate image files box. If image files are not needed, go to step 9.
- Select one of the available file formats:
- Set the graph images’
aspect ratio and dimensions:
- The default aspect
ratio is 16:9 and the default dimensions are 1920 x 1080 pixels.
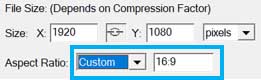
- Select an aspect ratio option from the Image Aspect Ratio drop-down.
- To enter an aspect ratio that’s not listed, select the Custom option. The custom aspect ratio box appears.
- Sizes and
aspect ratio can be linked when using a custom aspect ratio.
- When the sizes and aspect ratio are linked, changing one dimension automatically updates the other dimension such that the aspect ratio is always respected.
- When the sizes and aspect ratio is are unlinked, they are independent and changing a dimension automatically updates the custom aspect ratio. The other image dimension is not changed.
- To link or unlink sizes and aspect ratio, click the button between the X and Y size boxes:
- The icon or
button here indicates whether sizes and aspect-ratio are linked:
-
 this icon (not a button) means
sizes are linked to the aspect ratio and cannot be unlinked.
this icon (not a button) means
sizes are linked to the aspect ratio and cannot be unlinked.
-
 this button means sizes and
aspect ratio are linked, but they can be unlinked.
this button means sizes and
aspect ratio are linked, but they can be unlinked.
-
 this button means sizes and
aspect ratio are not linked, but they can be linked. Tip: Sizes are always
automatically linked to preset (non-custom) aspect ratios. Only custom aspect
ratios let you link or unlink sizes to the aspect ratio.
this button means sizes and
aspect ratio are not linked, but they can be linked. Tip: Sizes are always
automatically linked to preset (non-custom) aspect ratios. Only custom aspect
ratios let you link or unlink sizes to the aspect ratio.
-
- Set the
preferred image size, remembering the above rules about linked/unlinked aspect
ratios.
- Only numbers can be entered.
- Invalid
values are highlighted by a red border around the input box.
Note: Default sizes and format are declared in the Cameras, Images, Videos and Maps tab of the Simulator Project Settings dialog. See the Camera, Image, Video and Map Defaults topic for details.
- The default aspect
ratio is 16:9 and the default dimensions are 1920 x 1080 pixels.
- To save image files in the same place as the data files, check Use same location as for data files.
- Click OK.